 eoview
See your data right away
Open satellite images from your computer or from the internet, and see them in seconds.
eoview only reads the part of a file that you are looking at. A rough version shows up first and gets sharper as the details arrive. You can move around images of many gigabytes, and the window never freezes while it waits for the disk or the network.
Your graphics card does the drawing, so satellite swaths, map projections and the 3D globe are all just as smooth.
eoview is written in Rust, from the file readers to the interface. It is a single program with nothing else to install, and it draws with wgpu: Direct3D 12 on Windows, Vulkan on Linux and Metal on macOS.
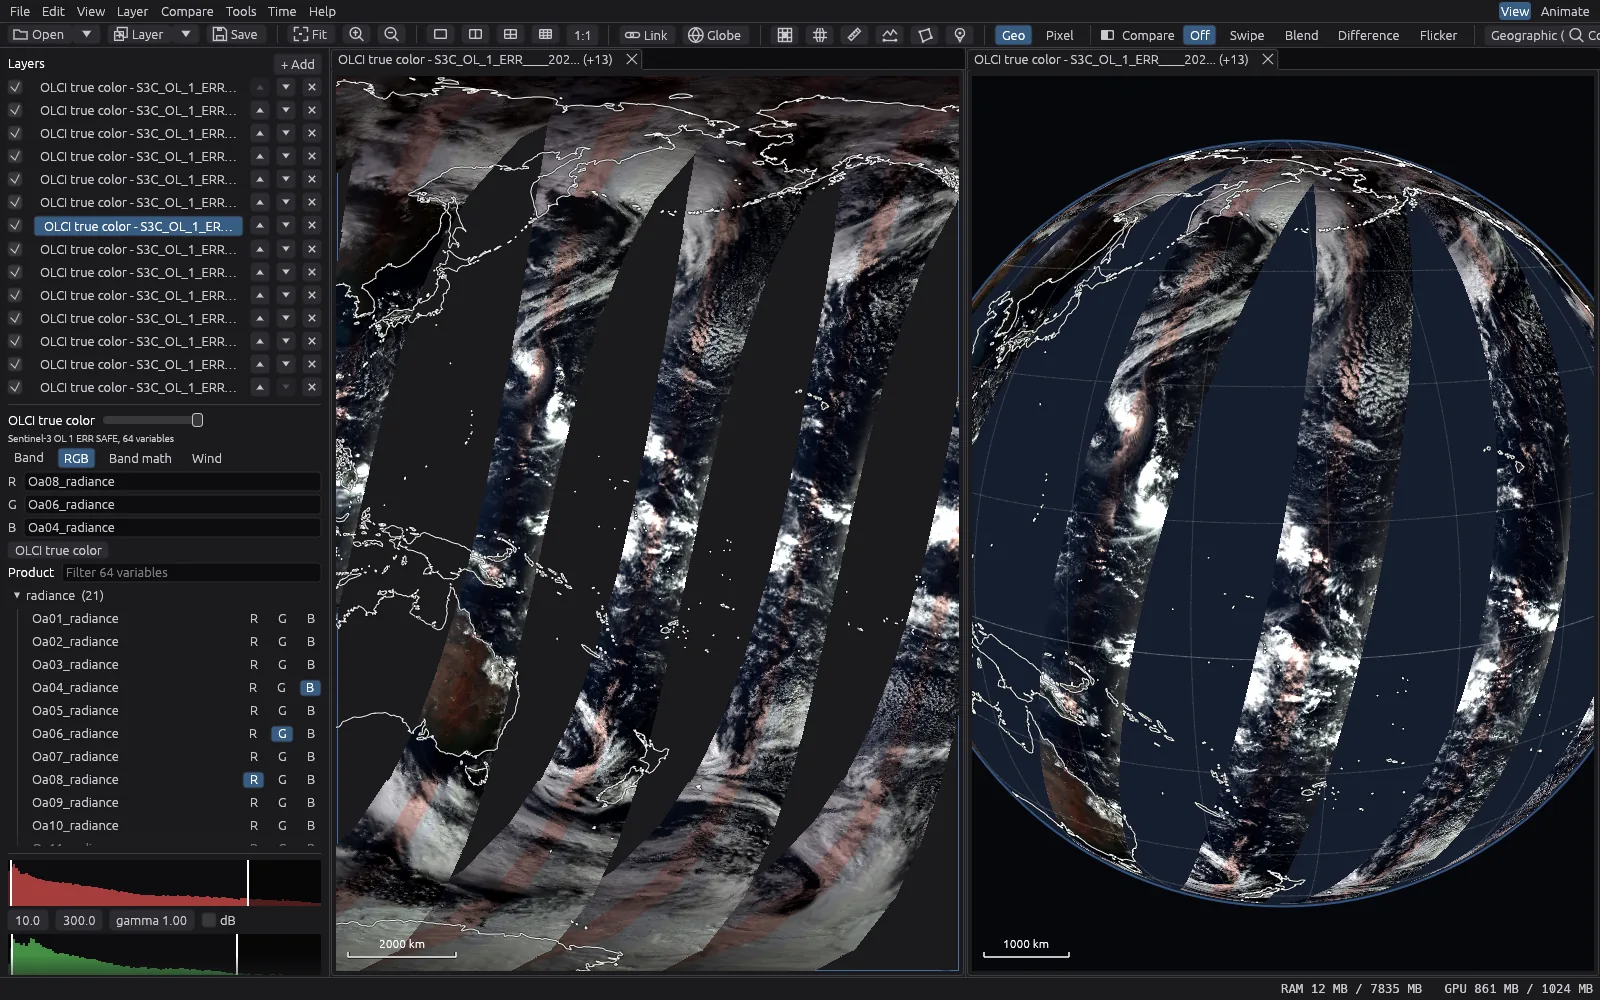
What it opens
- GeoTIFF and COG
- Including very large files, tiled files and files with overviews.
- NetCDF and HDF5
- Including files with latitude and longitude grids, like most climate and ocean data.
- Zarr
- Including the new EOPF products from ESA, and GeoZarr.
- Sentinel SAFE
- Sentinel-1, Sentinel-2 and Sentinel-3 products, as they come from the Copernicus archive.
- JPEG 2000
- Including Sentinel-2 images in their original format.
- NITF
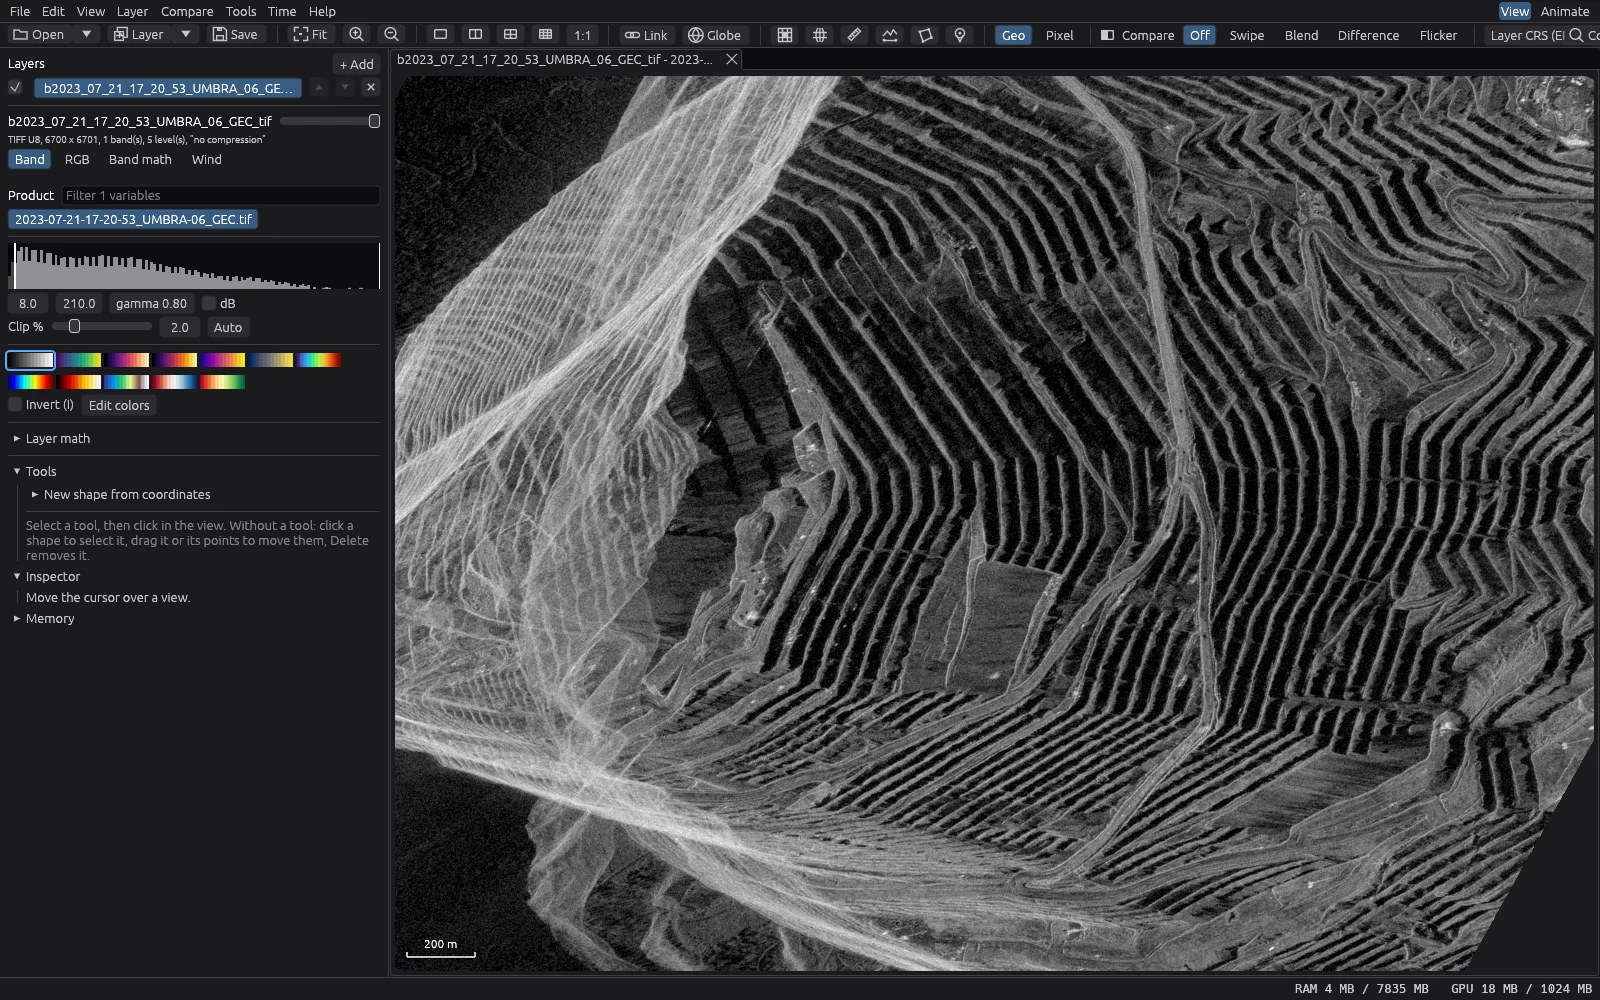
- Radar products in SICD and SIDD.
- From where
- Your disk, a web server or a cloud bucket. eoview keeps downloaded data in a cache.
How fast it opens
The time from opening a file to the first image on screen, and to a sharp, complete view.
| 01 s2 s3 s4 s | |
| Local files | |
| COG, 16-bit, 10000 x 10000 (200 MB) | 94 ms 133 ms |
| TIFF without overviews (200 MB) | 84 ms 688 ms |
| Sentinel-3 OLCI SAFE, NetCDF (0.9 GB) | 857 ms 892 ms |
| Sentinel-2 L1C, EOPF Zarr (0.7 GB) | 916 ms 1.4 s |
| Umbra SICD, NITF, complex (1.7 GB) | 572 ms 3.5 s |
| Remote files (HTTPS) | |
| Sentinel-2 L2A COG on AWS | 2.5 s 3.8 s |
| Umbra SAR COG on S3 | 2.1 s 3.2 s |
Measured on a PC with an Intel Core Ultra 7 265 and 32 GB of memory, with software drawing instead of the graphics card. Each number is the middle of three tries, in a window of 1920 by 1080 pixels. The local files were already in memory. The remote files came over the internet from Amazon's servers in the United States.
A season in 21 images
Give eoview a list of dates and it plays them like a film. These are 21 Sentinel-2 images of the Écrins mountains in the French Alps, from March to August 2025. eoview read them straight from the public Sentinel-2 archive in Amazon's cloud.
Work with your data
- Compare
- Link several views together, or swipe, blend, flicker and subtract two images.
- Time series
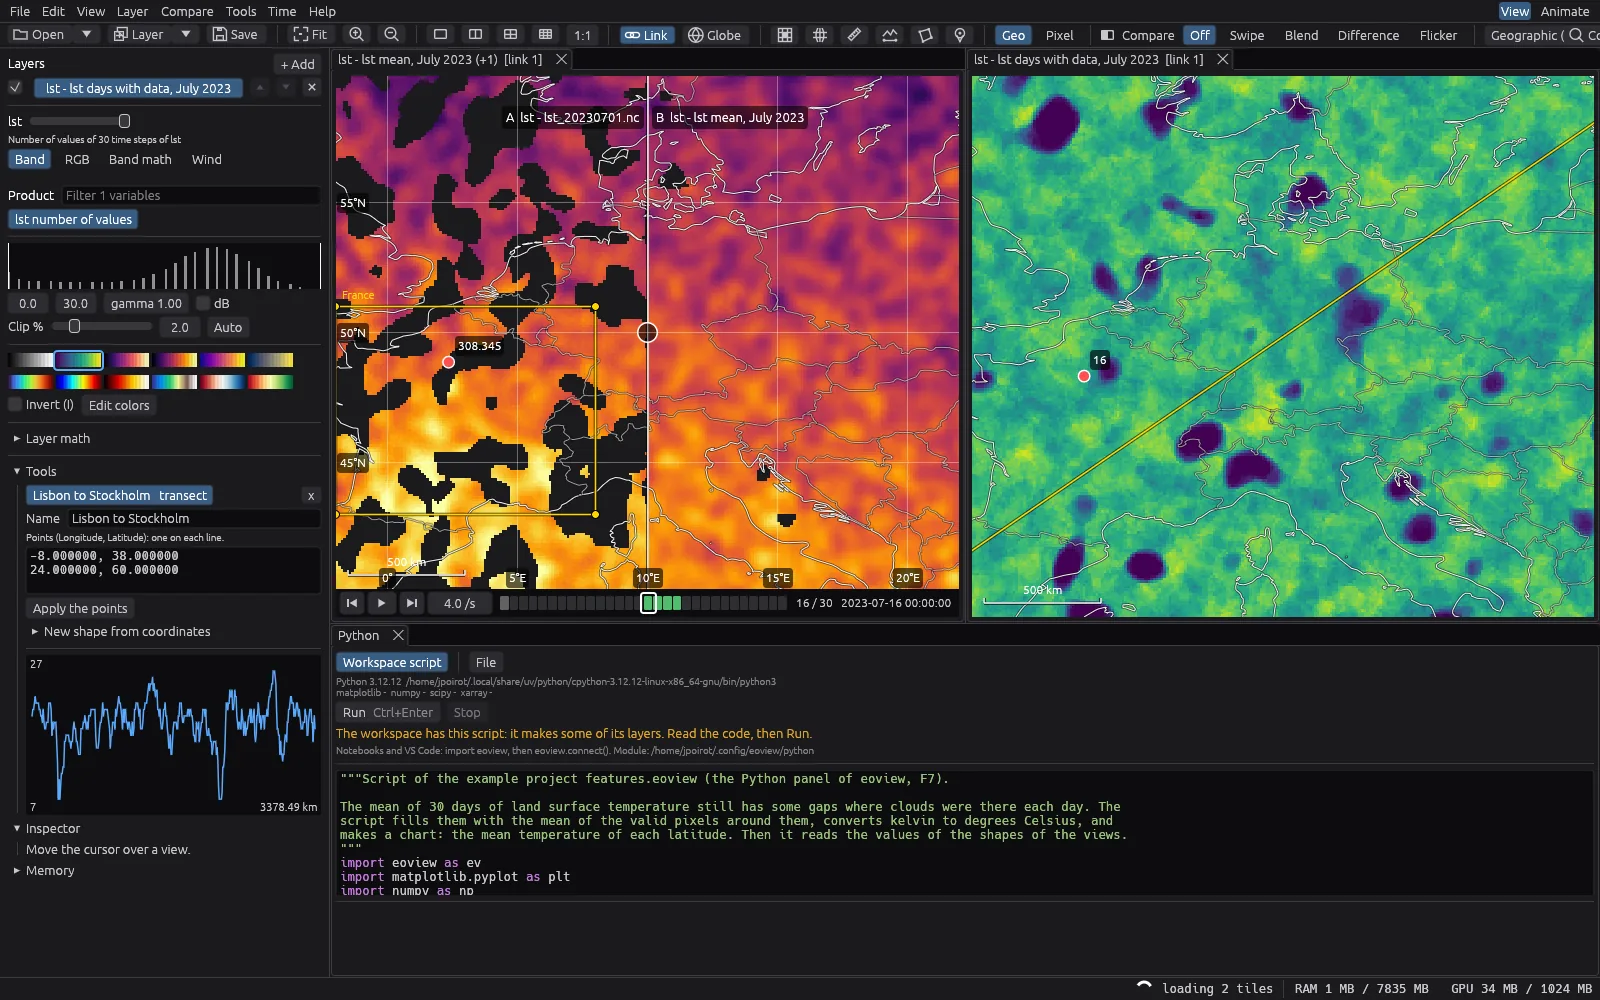
- Play many dates on a timeline, and compute averages and other statistics over time.
- Measure
- Read pixel values, draw lines and areas, and pin points.
- Calculate
- Combine bands or whole images with formulas, even from different products.
- Python
- Run your own scripts and Jupyter notebooks, and show the results as new layers and charts.
- Wind
- Show wind and currents as arrows or as moving particles.
- Share
- Export to GeoTIFF, make figures for papers and slides, and make videos.
- Projects
- Save a whole project in one file. When a file changes on disk, eoview reloads it.
A month of ocean weather
Sea temperature and ocean winds from NOAA, from 10 September to 9 October 2025, on top of NASA's Blue Marble. Watch typhoon Ragasa cross the Philippine Sea, and hurricanes Humberto and Imelda spin between the Bahamas and Bermuda.
The wind is drawn as particles that drift with it, and the globe turns while the days go by.
A year of Arctic sea ice
Daily sea ice maps from EUMETSAT OSI SAF for 2025. The ice grows until March, shrinks to its smallest in September, then freezes again.
The files use a polar grid, and eoview puts them on the globe as they are, with no conversion. A simple formula hides the open water, and the few days with missing satellite data are left out.
Download
eoview is free and open source (MIT or Apache-2.0). It runs on Windows, Linux and macOS, and keeps itself up to date.